


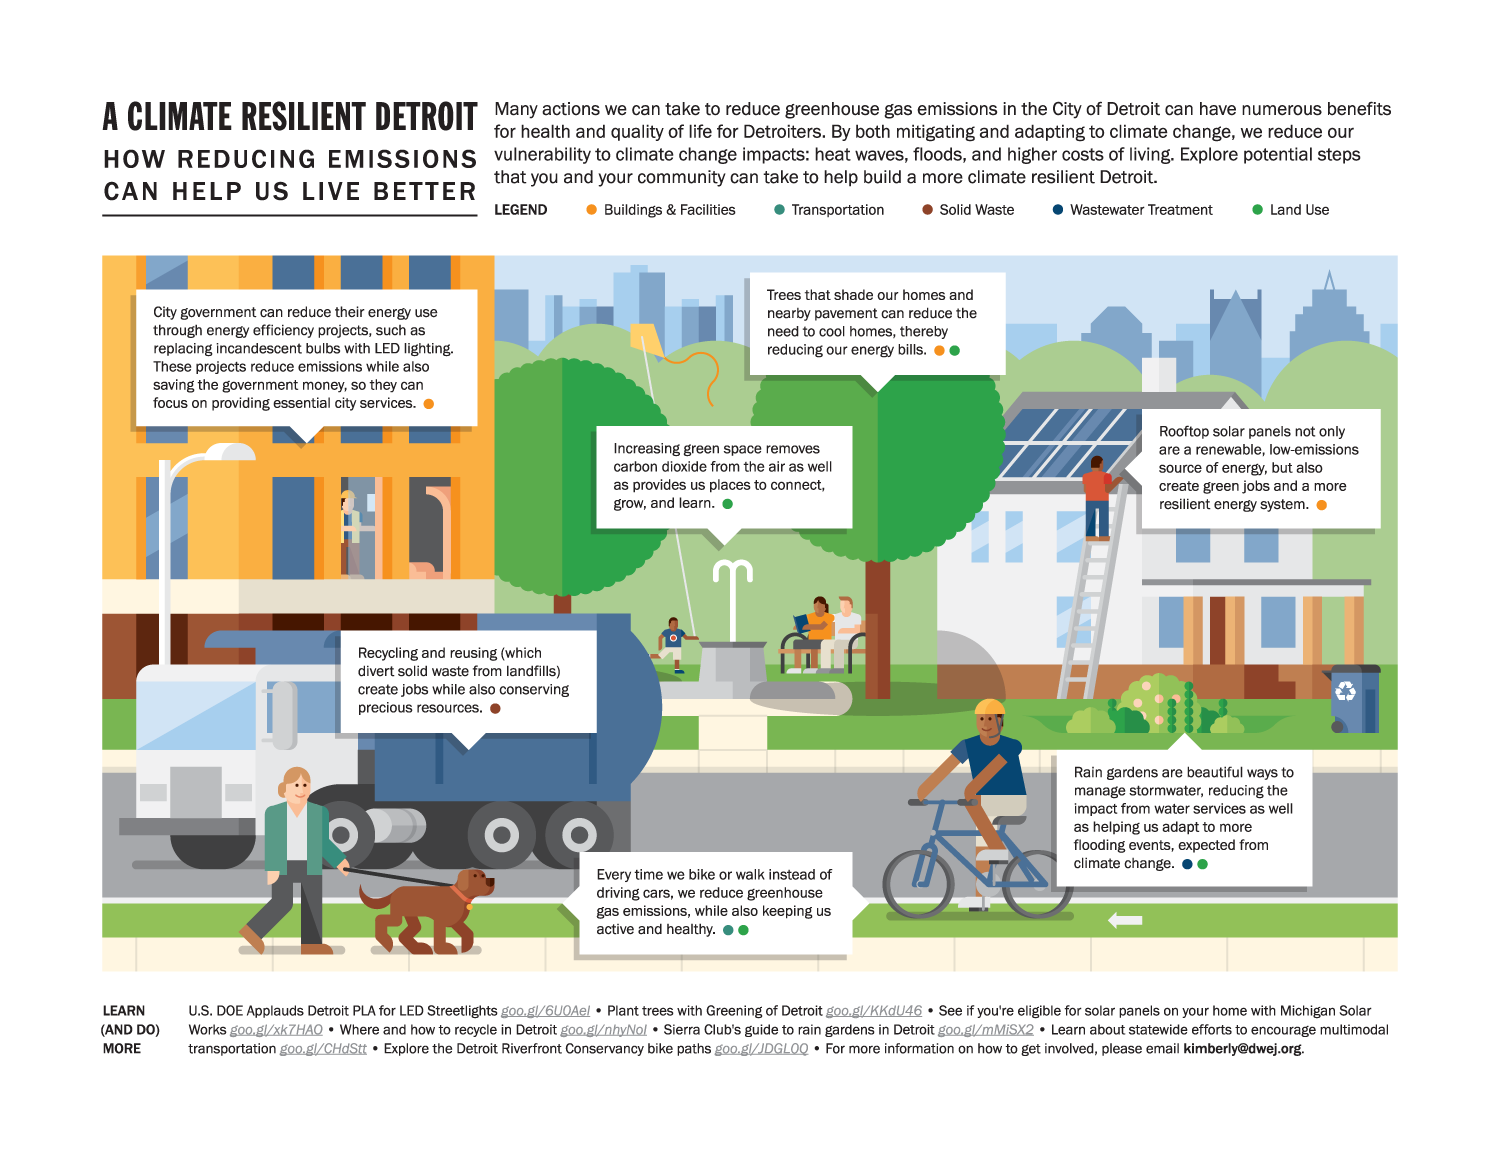


Illustrated infographics to accompany the first comprehensive inventory and analysis of the city of Detroit's greenhouse gas emissions, which was carried out by a team at the University of Michigan's School of Natural Resources and Environment. I also created a set of icons for the report's different categories of emissions.
2014